Projects / Back Bay
Back Bay Water Quality Analysis
Data analysis project in Python
- Dates
- May – Jun 2025
- Status
- Complete
- Dataset
- 2,400 rows, 1994–2018
- Tools
- pandas, NumPy, Matplotlib
Overview
In May and June 2025 I analyzed a 2,400-row dataset of water temperature, air temperature, and water depth for Back Bay National Wildlife Refuge in Virginia Beach, Virginia, covering 1994 to 2018. The data came from the Department of the Interior's water quality records for the refuge.
What I built
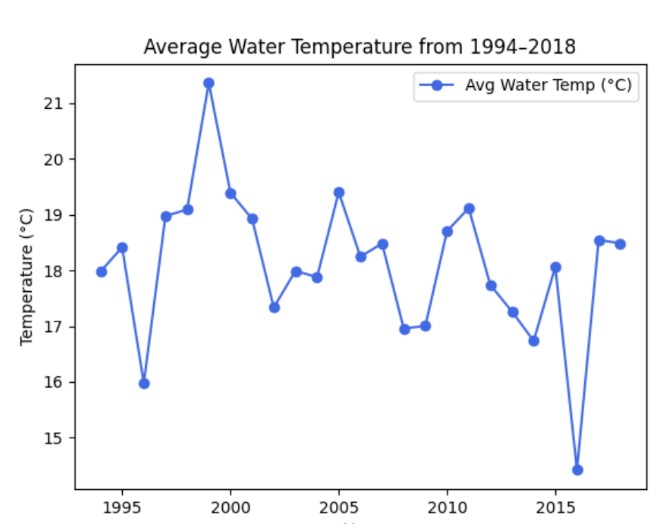
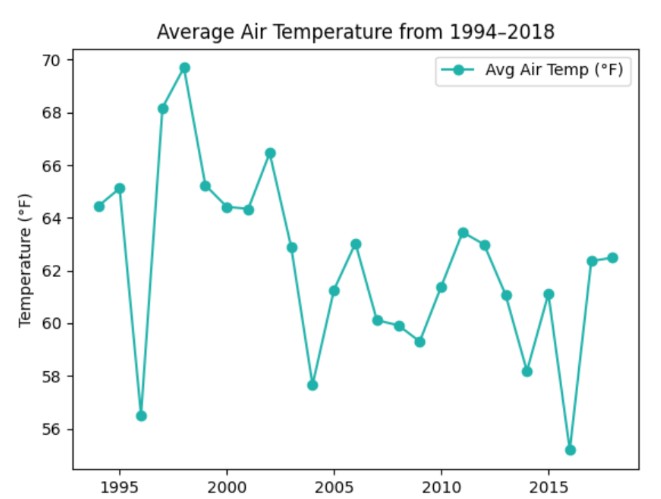
- Cleaned and organized the dataset in pandas, then computed yearly averages for each variable
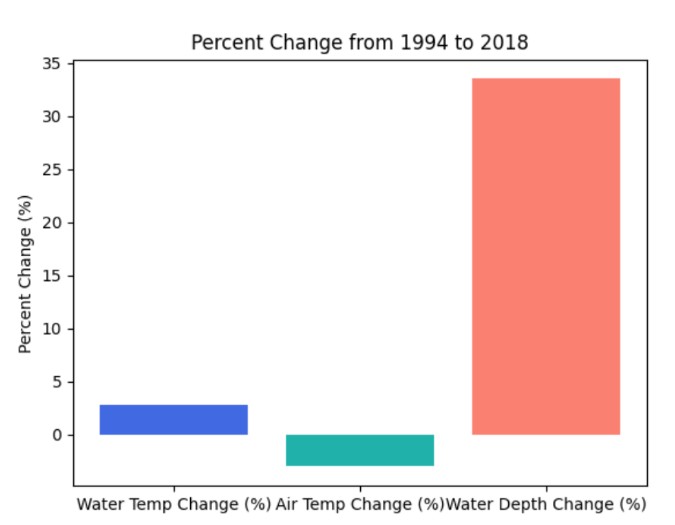
- Wrote a Python script that takes a starting and ending year from the user and reports the percent change in average water temperature, air temperature, and water depth over that range, plus the largest change in water temperature and the year it happened
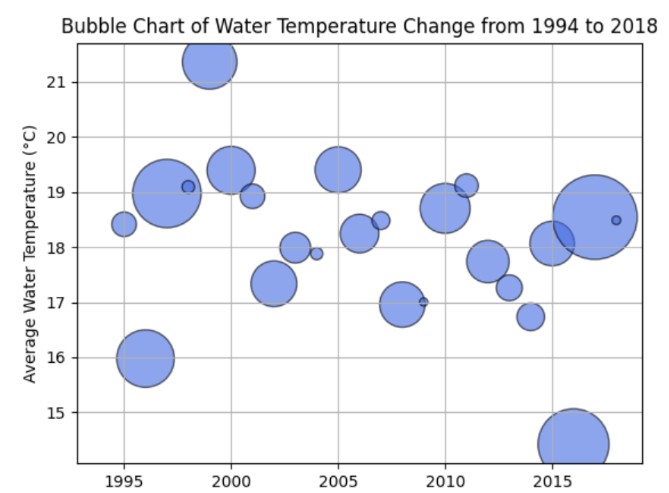
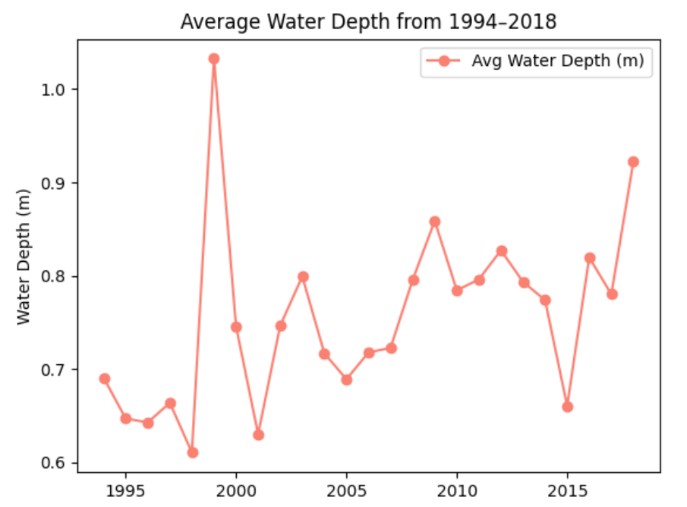
- Plotted each variable over time in Matplotlib, along with a percent-change bar chart and a bubble chart that combines yearly water temperature with the size of each year's change
Results, 1994–2018
- Water temperature
- +2.83%
- Air temperature
- −3.03%
- Water depth
- +33.50%
- Largest water temperature change
- 28.59%, in 2016
What the data shows
Average water temperature rose even though average air temperature fell slightly, so the two didn't move together over this period. That suggests the water temperature change was driven by something else, possibly water depth or other environmental conditions.
The broader point is that air and water temperatures don't always follow the same trend. Understanding a body of water means looking at several variables at once, which matters for managing coastal areas and planning for climate impacts.
Challenges
Real-world environmental data is noisy and often incomplete, so a meaningful part of this project was deciding how to handle missing or questionable readings without distorting the overall trends.
What I learned
- Practical data cleaning with pandas before any analysis is meaningful
- How to turn a raw dataset into a clear visual narrative
- Communicating quantitative results in a way a non-specialist can follow